Exploratory Data Analysis as a vital step to for understanding the data and explore the variables before deep-diving into the analysis.
Interesting findings in this Part:
The dataset of r/Superstonk set is 2,081,062 rows* 50 columns. After checking if there is missing values, changing data types, and deleting unnecessary data, the schema of data set shown as below:

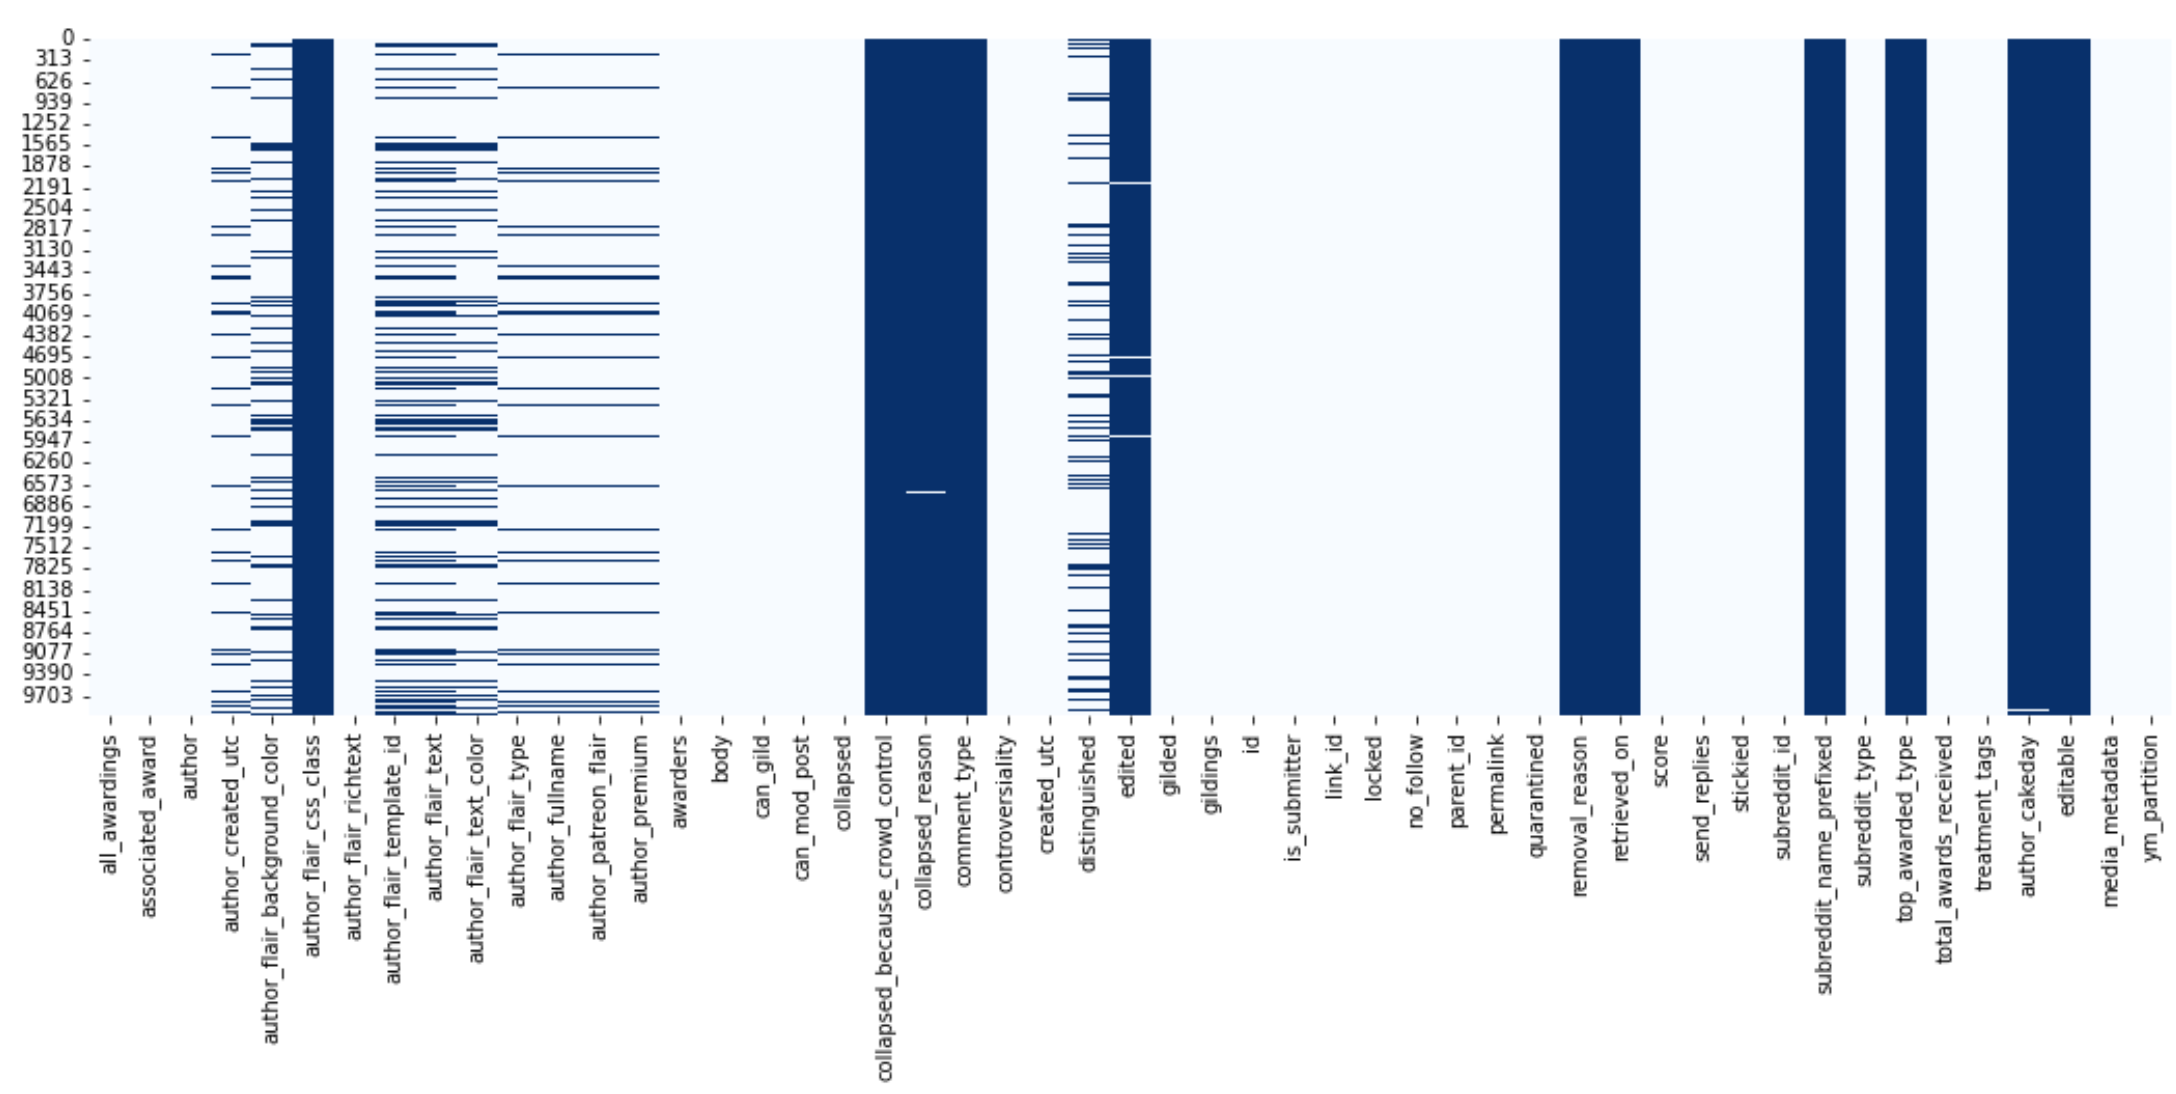
It is pretty intuitive to use the heatmap to see the missing data for each column, as shown in the figure below. In the figure, variables with full dark blue bars can be discarded without hesitation due to missing data for the entire column.
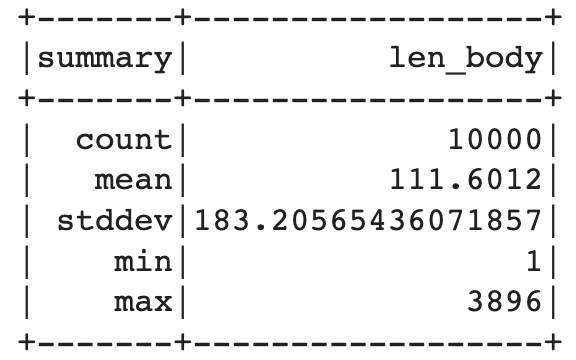
The contexts are represented by varible body, describing length of body:
After histogram the len_body data, we found that over 90% text date is less that 300, so filtering text length less that 150 to get the text length histogram plot.
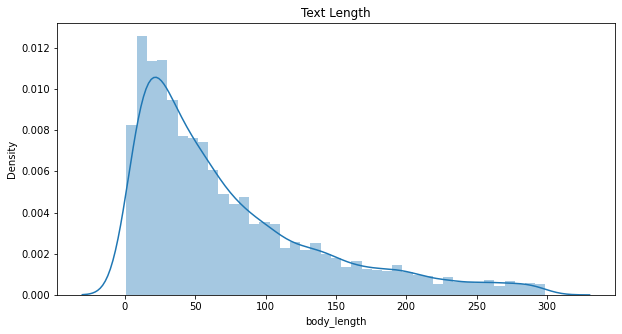
As can be seen, the text message length of the whole forum is relatively short, mainly concentrated in about 25. The longest text message length is 3896, after a specific look at the subreddit guidelines written by the mods.
While the value 1 means the post is contriversial and number 0 meas not.
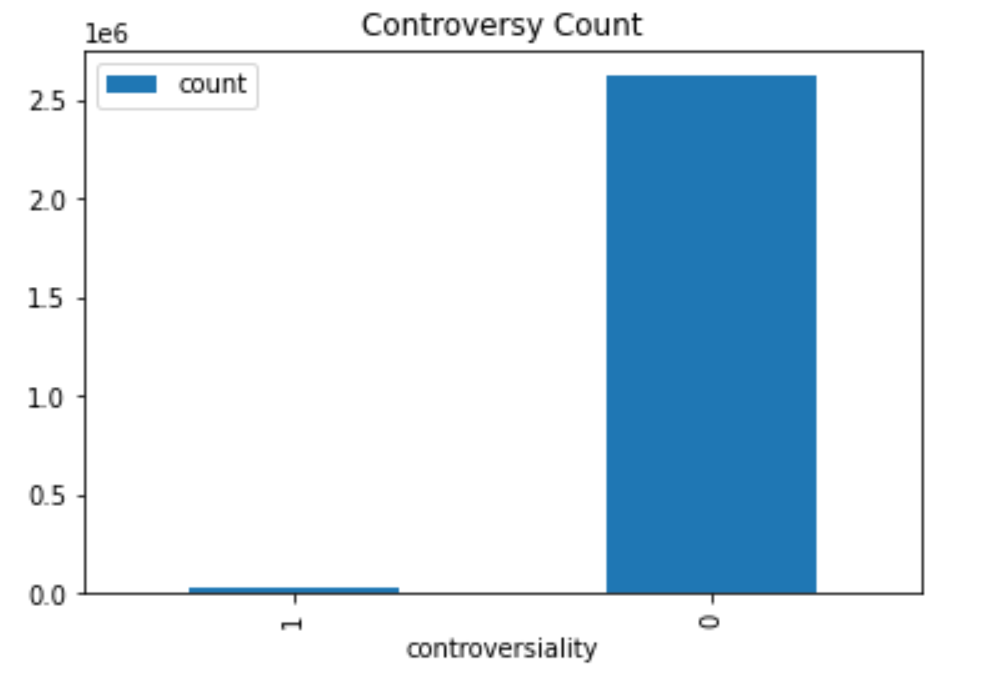
There are almost no controversial posts in this forum, perhaps because of the exclusive focus of this forum - only on GME - and the short time the forum has been in existence, people are speaking in harmony in the forum.
Users are an important part of the r/Superstonk community. For the individual user analysis, we focus on basic information about the user - the user's age, i.e. the length of time the user's account has been created, and the user's posting history in r/Superstonk.
Variable "author_create_days" is generated by 'author_created_time' and 'created_time'.
The distribution of account age of users are shown as below:
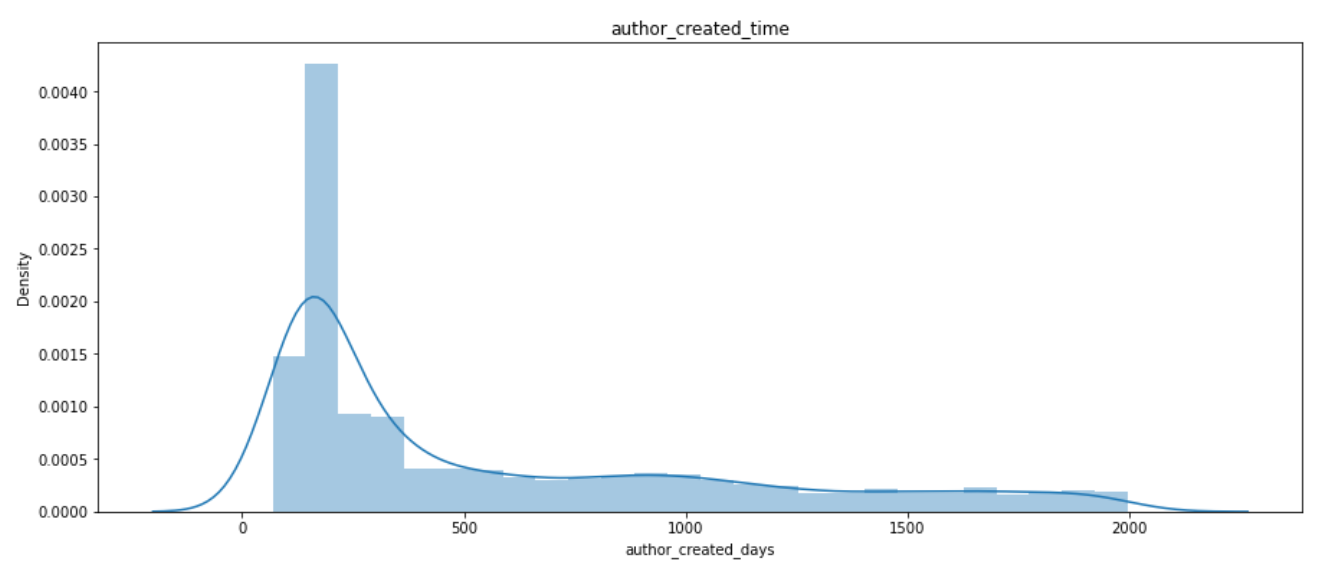
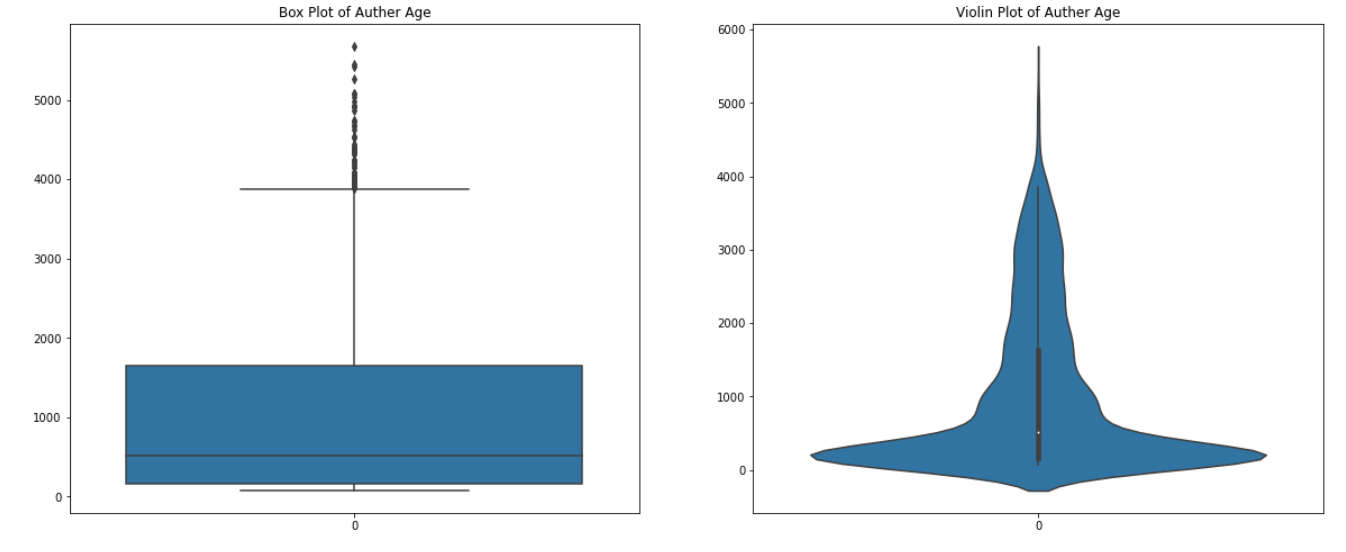
The majority account of users are about 1 years.
For the general user analysis,it will be a smart way to find top authors and focus on them. Typically, users with more posts will have more influence in the community, and the content of their comments will be more likely to extract valid financial advice.
Varible "post_ct" is created to count all posts by the same user. And the top 10 user and their comments counting number are shown as below:
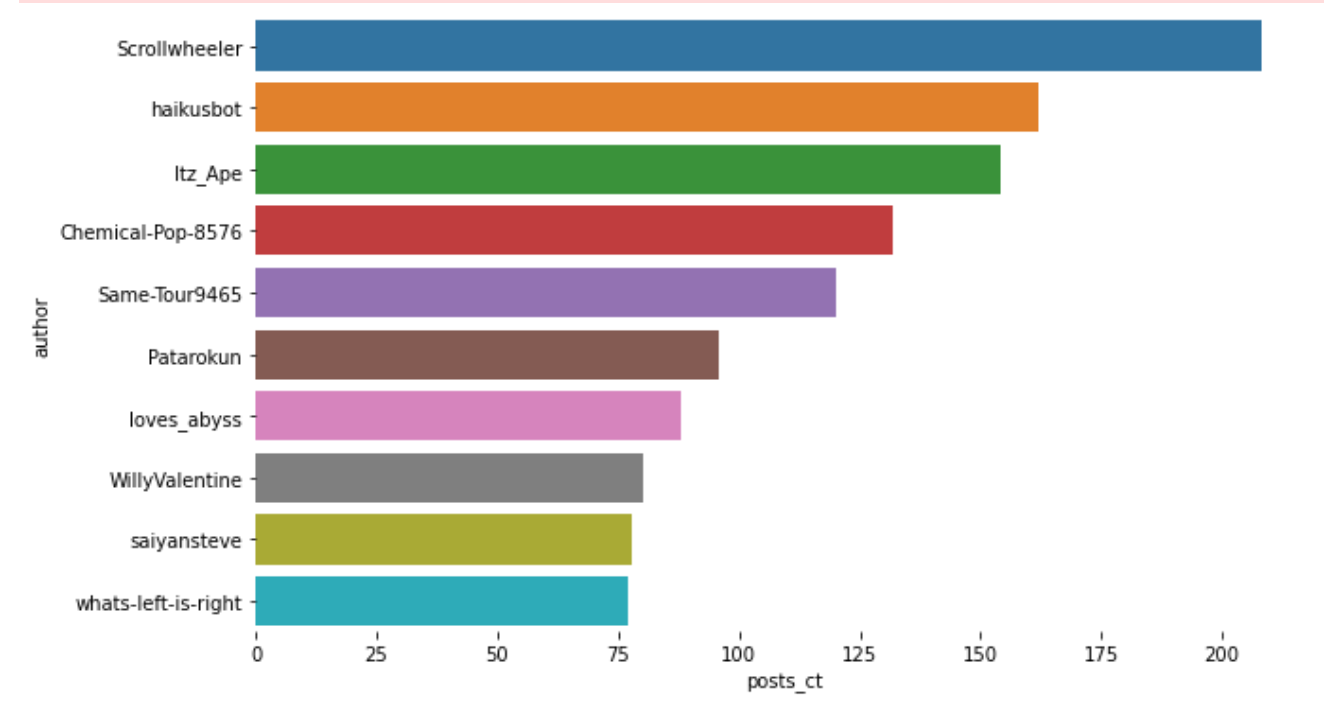
One interesting finding is that when I tried to search for "Scrollwheeler" which was the most active user from March-June last year, the page showed that the account had been locked.
User activity is equally noteworthy as an important indicator of forum activity. By sorting “post_ct” by date, we can get every day user comments counts. The first figure below show the user activities in April, when the subreddit just founded. The second figure contains the whole data set.
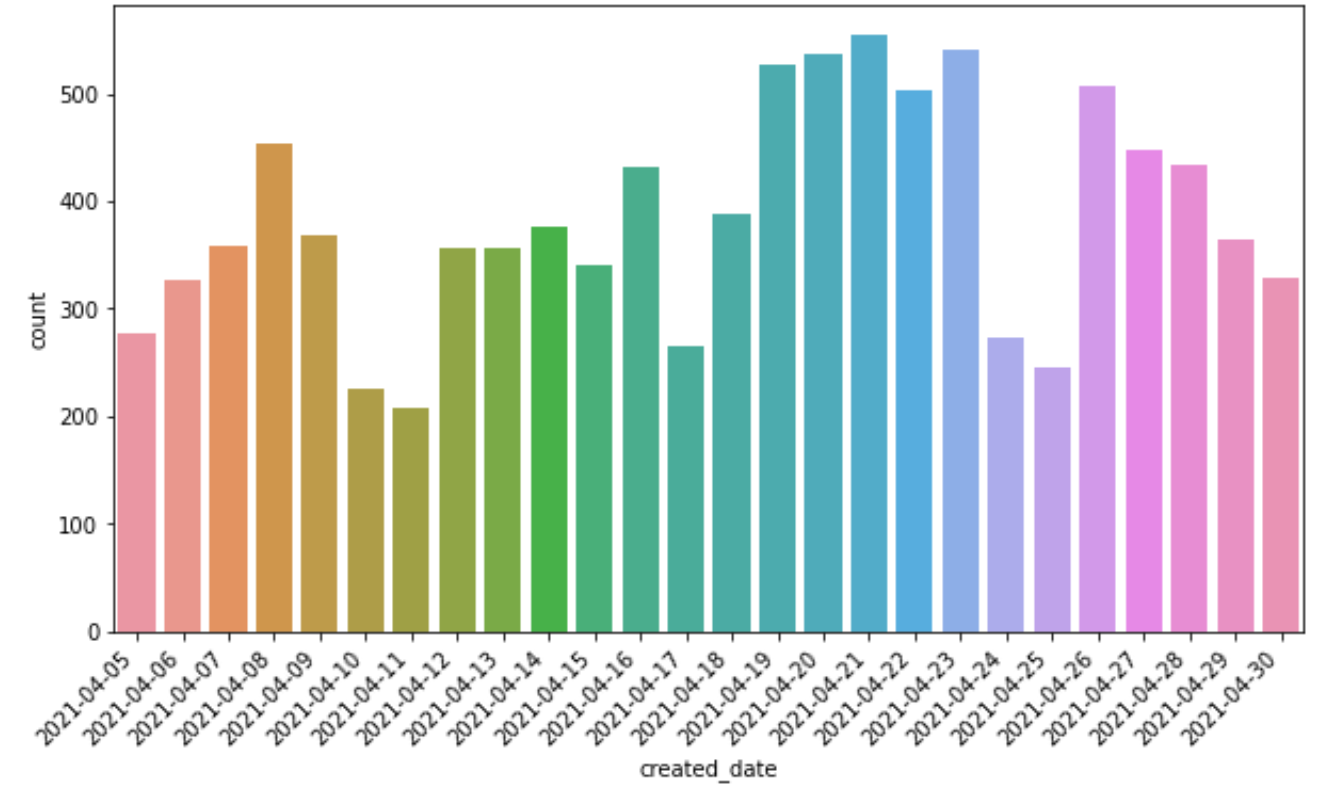

As it mentioned in Introductioin part, r/Superstonk didn't really get popular until April 5th. According to the survey, many people switch to r/Superstonk because they are dissatisfied with the random blocking of posts by the moderators of r/Wallstreet. This may also explain the near absence of controversial posts in this community.
Also, it can be seen from the line chart that the user activity fluctuates regularly, and the guess may be related to whether it is a weekend. Correlation analysis can be added in the future.
Using GME stock price data set to find out how the subreddit influence the stock price. The stock price of Game Stop are shown as below:

Also, try putting user activity and stock data together.
Since stocks are not traded on weekends, the user activity data after JOIN is also missing, but it still can be clearly seen that the growth of users and stock prices are in the same direction. In early June, when the GME stock price reached its highest, that day was also the time when the community generated the most posts. In mid-to-late April, the price of GME was relatively stable and low, and the activity of users was relatively stable. One can be sure, as a community with a single focus, the users of this community will be greatly affected by the GME stock price.